StockTell
Timely insights on stocks and market trends for investors and speculators
What is StockTell?
StockTell is a powerful investment tool designed to support investors and speculators grow their wealth.
StockTell is engineered to build and manage a smart, algorithm-driven stock portfolio using simulated buy and sell transactions. Historical backtesting indicates that the system has consistently outperformed annualized returns of major benchmark indices, including the S&P 500 and the Nasdaq-100, as well as leading robo-advisory platforms.
Insights generated by StockTell can empower investors and speculators to diversify and accelerate growth of their investment portfolios—either through manual emulation or automated software implementation.
Back-Tested Performance

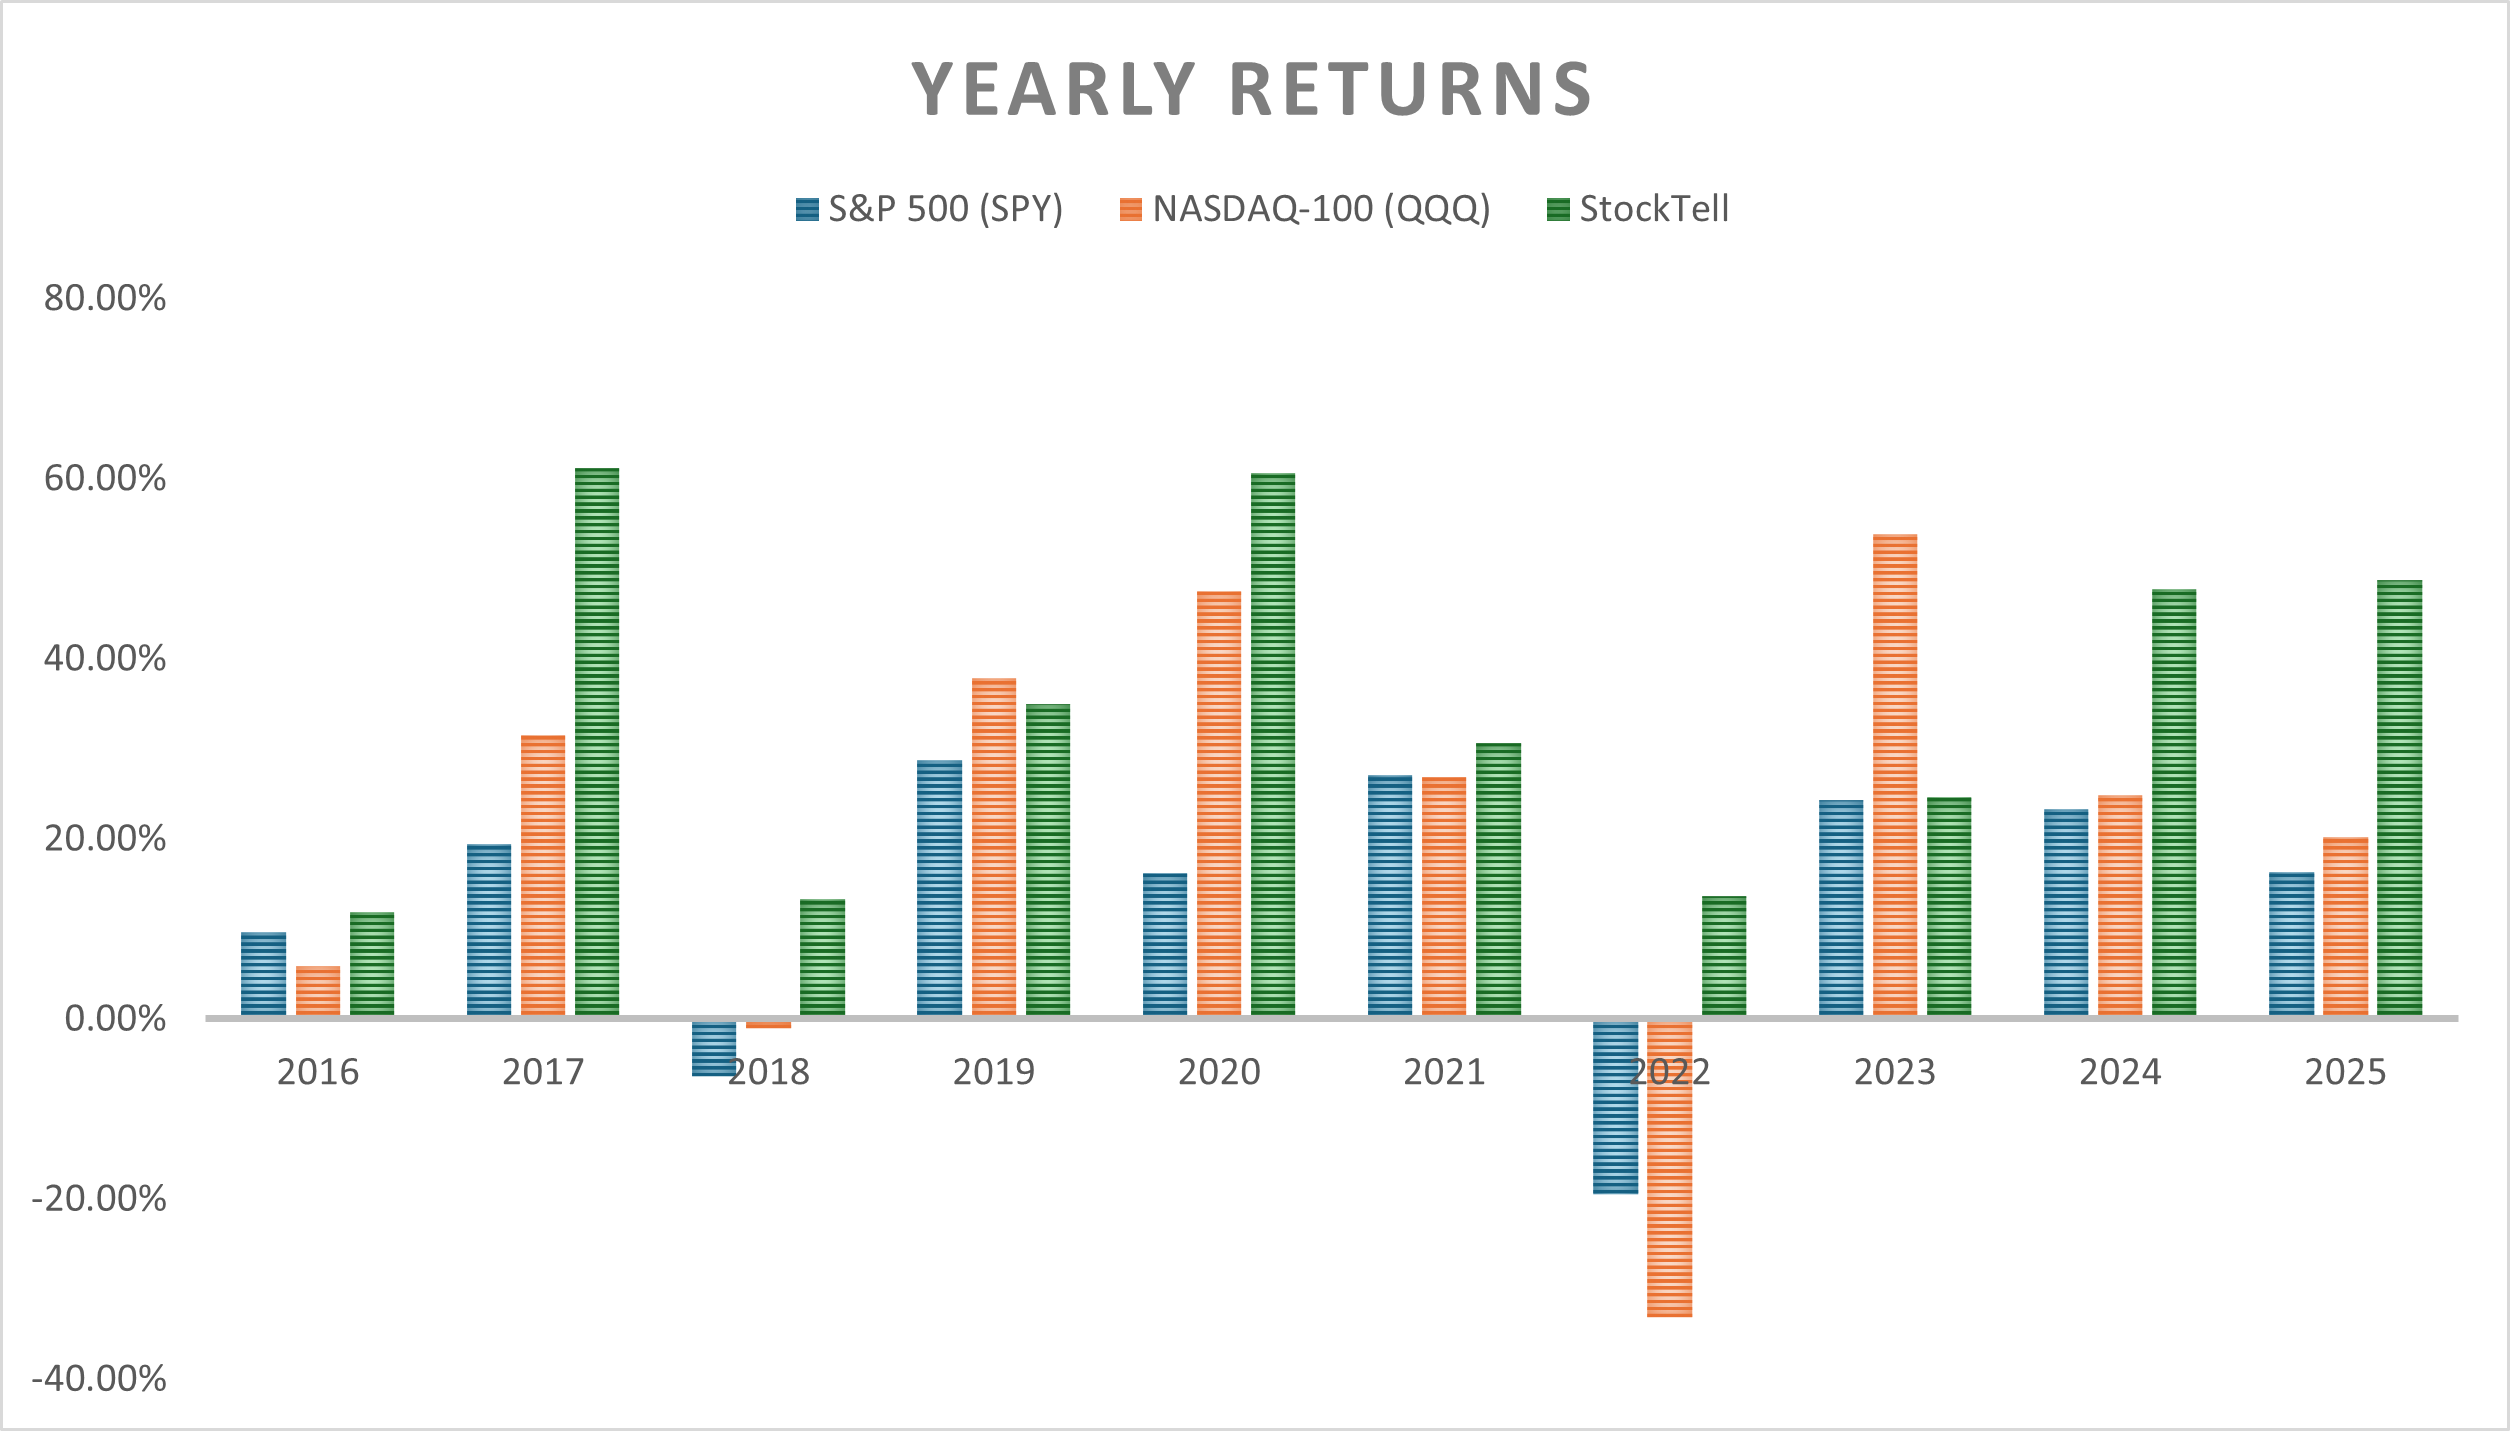
| Years | S&P 500 | Nasdaq 100 | StockTell |
| 1 | + 16.35 % | + 20.16 % | + 48.68 % |
| 3 | + 21.26 % | + 32.13 % | + 39.88 % |
| 5 | + 12.77 % | + 14.38 % | + 32.37 % |
| 10 | + 12.83 % | + 18.56 % | + 33.50 % |
How and Why StockTell works?
StockTell automatically manages a diversified simulated portfolio of stocks. By spreading investments across a broad range of positions, the system reduces overexposure to any single stock, sector, or market trend.
The system is built around three core components:
1. Stock Selection Strategies: These strategies analyze the Universe of stocks to generate buy and sell signals. Using structured heuristics, they assess a wide range of factors—including revenue and earnings growth, debt levels, free cash flow, valuation, market capitalization, price momentum, overall market direction, and broader economic conditions—to improve the probability of successful outcomes.
2. Stock Ranking Heuristics: When multiple stocks are identified as potential buys, ranking algorithms evaluate and prioritize them based on expected return potential and associated risk. This ensures that capital is directed toward the most promising opportunities at any given time.
3. Portfolio Management: The portfolio manager oversees a hypothetical portfolio of stocks (configured to maximum of 40) along with available cash reserves. On a regular schedule (such as weekly or monthly), it runs the selection strategies, ranks qualifying stocks, and allocates capital accordingly. Position sizing is designed to promote fairness by weighting holdings relative to their risk levels. The system also performs periodic rebalancing to free up capital and maintain optimal portfolio structure.
To manage downside risk, the system routinely exits positions that underperform relative to the broader market or fall short of expected return thresholds. This disciplined approach helps reallocate capital toward stronger opportunities. At the same time, gains from significantly appreciated positions are periodically harvested to generate additional liquidity, allowing the system to reinvest and potentially compound returns.
StockTell Portfolio Snapshot
| Start Date: | 12/31/2023 |
| Snapshot Date: | 03/31/2026 (Portfolio Age = 27 months) |
| Net Return: | 150.16% (vs. S&P 500: 37.23%, Nasdaq 100: 41.33%) |
| Number of Active Positions: | 29 (configured maximum of 40) |
| Number of Closed Positions: | 189 |
Note: This hypothetical portfolio is automatically managed by the StockTell system with trade simulations done once a month at the end of a month.
Top 10 Performers
| Symbol | Buy Date | Buy Price | Sell Date | Sell Price | % Gain |
|---|---|---|---|---|---|
| ASM | 03/31/2025 | $1.84 | 01/31/2026 | $8.99 | 388.59 % |
| HOOD | 11/30/2024 | $37.54 | 10/31/2025 | $146.78 | 291.00 % |
| AGX | 06/30/2024 | $71.95 | 06/30/2025 | $219.41 | 204.96 % |
| CDE | 05/31/2025 | $8.08 | 01/31/2026 | $20.44 | 152.97 % |
| NUTX | 03/31/2025 | $47.03 | 04/30/2025 | $109.97 | 133.83 % |
| MMYT | 12/31/2023 | $46.98 | 01/31/2025 | $109.27 | 132.59 % |
| AU | 05/31/2025 | $41.96 | 03/31/2026 | $97.36 | 132.04 % |
| TSSI | 05/31/2024 | $2.09 | 08/31/2024 | $4.79 | 129.19 % |
| AG | 08/31/2025 | $9.13 | 01/31/2026 | $20.83 | 128.11 % |
| NVDA | 12/31/2023 | $49.49 | 03/31/2025 | $108.36 | 118.93 % |
Distribution of Gain/Loss %
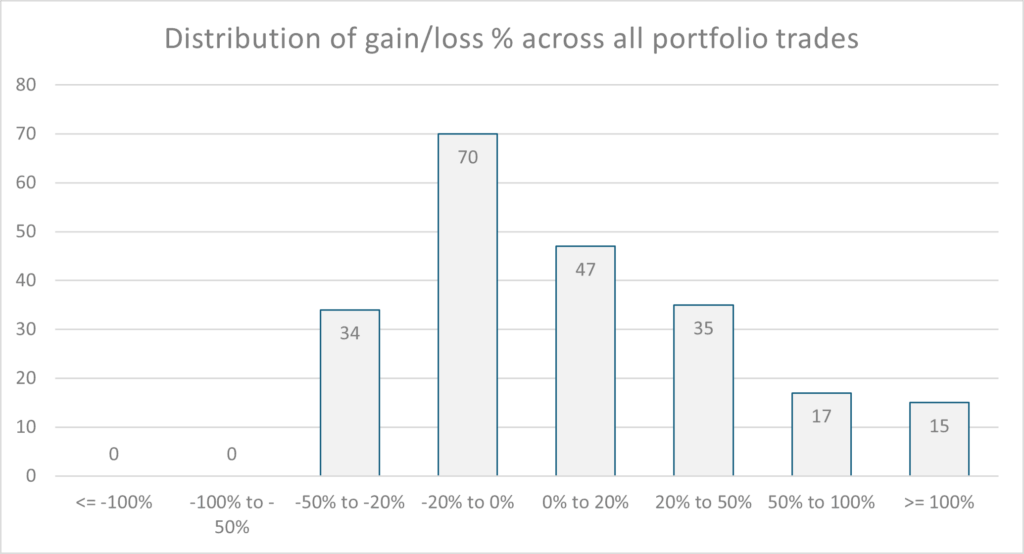
As illustrated in the “Distribution of Gain/Loss %” chart, the system is structured to let winning positions run while trimming losses early, limiting downside per holding. Historically, it has demonstrated the ability to identify multiple high-performing stocks (“multibaggers”), which contribute meaningfully to portfolio growth and long-term compounding.
Recent Updates
Last Updated: April 05, 2026
We continue to improve performance of StockTell system. The following provides a high level summary of recent updates to the system.
February 2026: Re-configured portfolio size to a maximum of 40 stocks. Improved stock selection strategies and scoring models.
December 2025: Improvements to portfolio re-balancing heuristics to raise cash.
November 2025: Added support for companies based outside of USA.
October 2025: Adaptive cost basis depending on amount of available cash in the portfolio. This allows more effective use of available cash resulting in better compounded returns.
September 2025: Improved Bullish/Bearish market direction detection. Added automatic and periodic rebalancing of portfolio to raise cash from positions that have made significant gains.